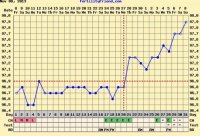
My chart this month looks different than past months. This month it shows where I ovulated but since my BBT has been on a slow and steady rise. (The empty circles post O are because I woke up earlier than usual on those days)
This site uses cookies to help personalise content, tailor your experience and to keep you logged in if you register.
By continuing to use this site, you are consenting to our use of cookies.