aspen_darling
New Member
- Joined
- Apr 3, 2014
- Messages
- 1
- Reaction score
- 0
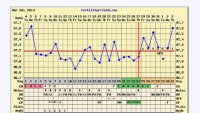
at 5 DPO my BBT dropped below my coverline, but the next day it went back up & has been increasing since then. I always heard mixed information about when implantation occurs. Some say 6-12 DPO
others say 7-13. is it possible that this dip on my chart is an implantation dip? & if it is, how soon can I expect a BFP?
others say 7-13. is it possible that this dip on my chart is an implantation dip? & if it is, how soon can I expect a BFP?


