You are using an out of date browser. It may not display this or other websites correctly.
You should upgrade or use an alternative browser.
You should upgrade or use an alternative browser.
When did I ovulate?
- Thread starter sb51416
- Start date
MindUtopia
Well-Known Member
- Joined
- Jan 6, 2012
- Messages
- 9,548
- Reaction score
- 1
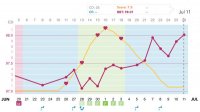
I'm not really familiar with these charts. I'm assuming the yellow line is some sort of measure of peak fertility? What is that based off of? Temps in previous cycles? Opks?
Based on your temps alone, I would say CD20 or 21. That's the first time there seems to be a noticeable rise above your pre-O temps. There is a tiny bit of a slow rise before that from CD16, but I don't know what to make of that and it doesn't obviously look like ovulation since the temps aren't all that different from what they are earlier in your cycle. It could be just that you don't have many pre-O temps there, so it's hard to know what's normal for you.
Based on your temps alone, I would say CD20 or 21. That's the first time there seems to be a noticeable rise above your pre-O temps. There is a tiny bit of a slow rise before that from CD16, but I don't know what to make of that and it doesn't obviously look like ovulation since the temps aren't all that different from what they are earlier in your cycle. It could be just that you don't have many pre-O temps there, so it's hard to know what's normal for you.
Similar threads
Users who are viewing this thread
Total: 2 (members: 0, guests: 2)
Latest posts
-
General chatter while we wait (and commentary on the "pull out method") (1 Viewer)
- Latest: gigglebox
-
-
-
-


