Please help me analyze my chart that is attached. I appreciate any opinions or advice.
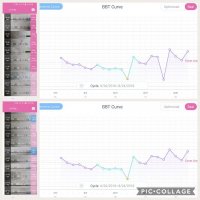
I recently started tracking my BBT and LH surges. I see a dip which appears to be ovulation on 8/12. You can see the LH surges on my tests on 8/9 and 8/10. On 8/10 I took a Clear Blue Ovulation test and it was positive.
In the first chart pic on 8/18 I had a major dip in temp of 96.37° (possibly implantation?). I decided to treat this temp as an outlier since it was my 2nd temp for the morning and choose to use an earlier temp of 97.47°. Both temps were taken 20 minutes apart. I was laying in bed and dozed off before taking the 2nd temp that was lower.
Anyways... what do you see with my chart? I ended my pack of BCP on July 31st so Aug 1st is my first day without them. I was only on them for 4 months so I am happy that my ovulation schedule seemed to stay in place. Today's temp is not pictured but it was above the cover line at 97.74°
Any insights would help.
Thank you for your time!