sunshine2014
Well-Known Member
- Joined
- Mar 25, 2014
- Messages
- 5,842
- Reaction score
- 0
I'm super new to this temp thing -- this is my second month. Last month, I was pretty bang on - with a dip around O and then a sharp rise, followed by a dip before af.
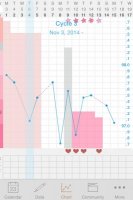
THIS Month however, I had a very sharp dip, then a rise, then another very sharp dip, followed by a rise around O. I stayed up for a few days, then had a slight dip the last two. I'm so confused. Around the first 2 dips, I had ewcm, so I figure I was at my peak then. I've also had slight twinges the last 2 days, but no ewcm, so I don't believe it's mittelschmertz this late, as I believe I O around day 10-12.
Is it normal to have that many dips in the week-10 days around O. and What else is the most reliable sign - twinges or cm?
Here's a picture!