coquis224 Well-Known Member Joined Jan 12, 2015 Messages 244 Reaction score 6 Aug 21, 2018 #1 These are the results from my FETA scan.... I don't understand any of it any help would be appreciated... Thanks Attachments Capture.jpg 41.4 KB · Views: 40
These are the results from my FETA scan.... I don't understand any of it any help would be appreciated... Thanks
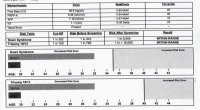
Elsa50501 Mommy of 2! Joined Sep 25, 2013 Messages 848 Reaction score 26 Aug 21, 2018 #2 It all came back low risk
coquis224 Well-Known Member Joined Jan 12, 2015 Messages 244 Reaction score 6 Aug 21, 2018 #3 Thank you! I just wan't understanding the bar graphs etc...
Moom7900 Well-Known Member Joined Mar 6, 2013 Messages 1,556 Reaction score 2 Aug 23, 2018 #4 coquis224 said: Thank you! I just wan't understanding the bar graphs etc... Click to expand... I think the bar graphs are showing the higher risk age zone for Downs etc. For example, it shows the low risk zone as after 20yrs and before 32 xx
coquis224 said: Thank you! I just wan't understanding the bar graphs etc... Click to expand... I think the bar graphs are showing the higher risk age zone for Downs etc. For example, it shows the low risk zone as after 20yrs and before 32 xx


 General chatter while we wait (and commentary on the "pull out method") (4 Viewers)