Charts can be all over the place - there isn't one specific way a chart will look if it ends in a bfp or af. They're really meant for general guidance and aren't a science.
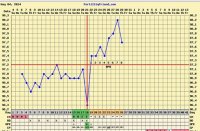
That being said - some women see an implantation temp dip during the lp when they are pregnant. If that's the case than the dip will be followed by another temp spike tomorrow, making your chart triphasic. However - not all triphasic charts end in bfp and not all bfps have a triphasic chart. The only thing I really use my chart for is 1. to reassure myself that I have ovulated; 2. to help identify when exactly I ovulated (for future cycle planning); and 3. to know I'm getting my period THAT day (as that will be evidenced by a temp drop below coverline - if my temp is still high, I know I don't have to worry about af that day).
So! That temp drop could be promising, or it could mean nothing. As with all the signs and symptoms during the dreaded tww. If you look around on ff there's a section that shows a random compilation of charts that ended in bfps and you can see how different they all are from one another.
Moral is - your chart looks "right" because your temps are still above coverline. Everything else is just speculative. Fx for you!! GL!

")