Well, its really hard to say anything about your chart without having a whole cycle to compare to. BUT, it looks like you might of ovulated on CD18 and you are now 5-6 days past ovulation.
Here is why I say that. At the beginning of your cycle (which is missing obviously) your temps will be in a semi-lower range, so I assume your temps were floating somewhere around the low 96s. When you ovulate, you will typically have a temp that goes lower than the others (but not always) then immediately your temp will jump up really high (atleast .4 degrees) and then sit in the higher temps after ovulation occurs. Then if you are pregnant, the temps will stay high, if not, they will fall eventually and go really low again when AF starts.
The other thing you are going to figure out right now if the length of your luteal phase (LP). The luteal phase is the period of time from ovulation to your period and that length of time doesn't change. For me, it is 12 days. For most women it is between 10-16 days, with the average obviously being 14 days (which is why we call the waiting to test period, the two week wait)
It's important to know the length of your LP because that'll let you know for sure if you are late for your period or not. You might ovulate on different days each cycle, so it's best to figure out if you are late for your period from your LP and not from when you were expecting it. When i am not on ovulation medication, ic an ovulate any time from CD19- 45 so temping helps me know when i did, in fact, ovulate. And it lets me know if my period is late because I know the length of my LP. Obviously, for me, if my LP goes longer than 12 days, say 14 days, then there is obviously something going on.

Now, when you want to test is completely up to you, some women wait until their period is late (like me) or some like to start testing around 8-10DPO. Either is fine and completely up to you.
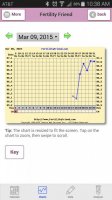
Anyway, if you want to see an example of a chart with the ovulation temp rise and so on, you can click on my chart below and it'll lead you to a page that shows my chart from last cycle. That chart shows the temps being low, then jumping up after ovulation and then staying high until AF (or in that case, when i went off progesterone).
If you have any other questions, feel free to ask!