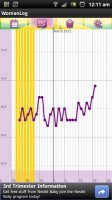
minimocha Well-Known Member Joined Mar 5, 2012 Messages 82 Reaction score 0 Mar 17, 2012 #1 I know my temps are going up and down like crazy at the beginning... I had +opk on CD21. THe last temperature on the chart is CD29. How does it look so far? And do you guys get these fluctuations? I think I'll be testing on CD35... Attachments Chart Cycle3.jpg 38.1 KB · Views: 16
I know my temps are going up and down like crazy at the beginning... I had +opk on CD21. THe last temperature on the chart is CD29. How does it look so far? And do you guys get these fluctuations? I think I'll be testing on CD35...